Omnichannel for Customer Service – Insights Dashboards
Within Omnichannel for Customer Service we can enable Power BI based dashboards to give insights into your customer communications across all your messaging channels. In this post I will review how to enable these dashboards and what information your supervisors will then be able to view.
We actually have two types of supervisor dashboards. The first are the intraday statistics. These are refreshed every 15 minutes and shows a snapshot of KPIs relating to recent conversations. We have two intraday insights dashboards, one shows details for conversation totals across all channels and the other gives information which is agent specific. (The agent dashboard can also allow the supervisor to see the current agent presence and even update it directly from the dashboard.)
We also have additional insights dashboards which give a deeper analysis of conversations over a longer period. In this post I will be describing these “historic” insights dashboards. But you may also benefit from looking into the intraday insights. (I might cover those in more detail in a future post!)
Note: You will need a Power BI Pro license to be able to install the Omnichannel Insights app.
You will find Microsoft’s install instructions and full details of additional prerequisites here.
The install steps are as follows;
- Ensure embedding Power BI reports in Dynamics 365 customer service is enabled
- Enable sentiment reporting
- Install Omnichannel Insights for Dynamics 365 app
- Connect to Omnichannel Insights app
- Set the refresh frequency on your dataset
- Publish your application
- Add Power BI dashboards to Omnichannel for Customer Service
Note: There are quite a few steps to the setup process. But stick with it as each step is pretty simple, so you shouldn’t have many problems completing this.
Step One – Ensure embedding Power BI reports in Dynamics 365 customer service is enabled
In the power platform admin center, select your instance and then within the settings option open the “Features” option.

Below you can see that my “Power BI Visualization embedding” setting is enabled.

Step Two – Enable sentiment reporting
You need to ensure that “sentiment drivers reporting” is enabled within Omnichannel.
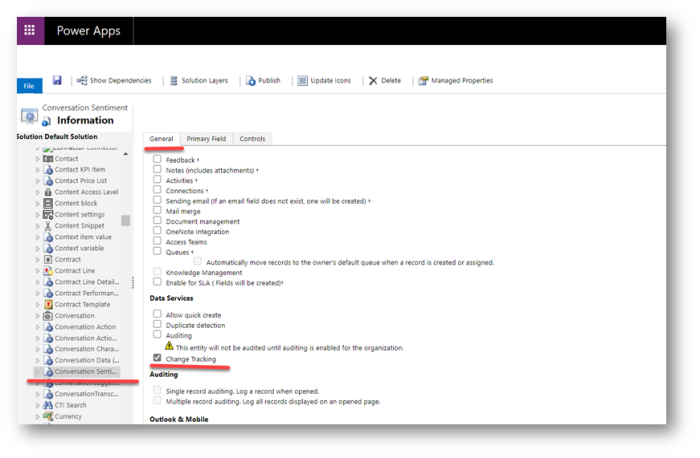
Before doing this also confirm that change tracking is enabled on the conversation sentiment entity. (Note: Mine was enabled already but it is worth checking!)
Below you can see that on the properties tab for the conversation sentiment entity I have change tracking enabled. Don’t forget that it you change this option you’ll need to publish the change!
Then within the Omnichannel Administration app, open the sentiment analysis settings option. In here you will find an option to “report sentiment drivers in Omnichannel Insights”. You will need to confirm this is enabled.

Step Three – Install Omnichannel Insights for Dynamics 365 app
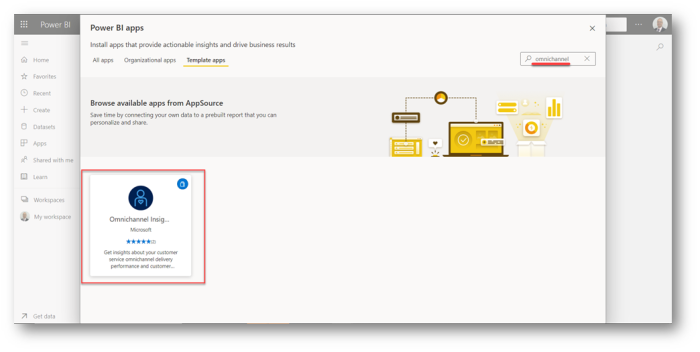
As an administrator open Power BI. Then use the “Get Data” option to choose the Omnichannel insights app.

Below you can see that I have searched for “Omnichannel”. The Omnichannel insights app has been found and I can select it.
I now open the app and select “GET IT NOW”.
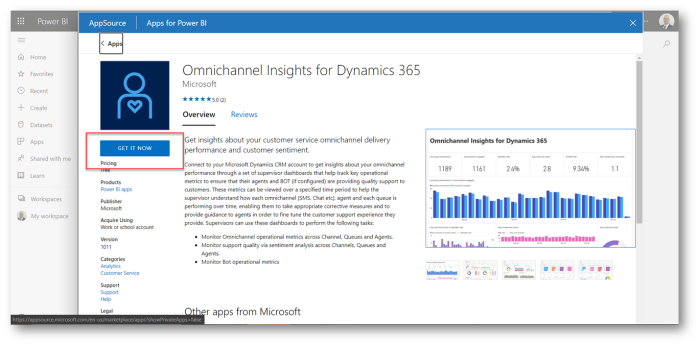
Assuming you are happy to continue that click “Install”

The app will now install. It only takes a few moments!

Once complete you will see the Omnichannel Insights app within Power BI.

Step Four – Connect to Omnichannel Insights app
Now we need to connect the insights app with your Omnichannel for Customer Service instance.
When you first open your Power BI Omnichannel insights app you will see that all the data is blank. Notice the notification which says “You’re viewing this app with sample data”. Click the “connect you data” option next to this message.

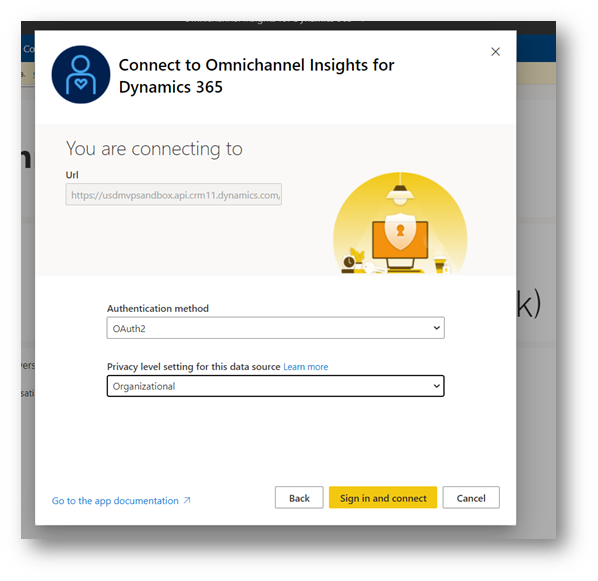
Next you enter your Dynamics 365 service root URL and click next.
Tip:
If you don’t know what this URL is check out the customizations option in your advanced settings. And look for the developer resource option as within here you’ll find details about your instance, including this URL.

Next I set my privacy level to “Organizational” and clicked sign in and connect.
Step Five – Set the refresh frequency on your dataset
Your next set will be to set the frequency to refresh your data. This is a simple process which allows us to ensure the data is automatically refreshed daily.
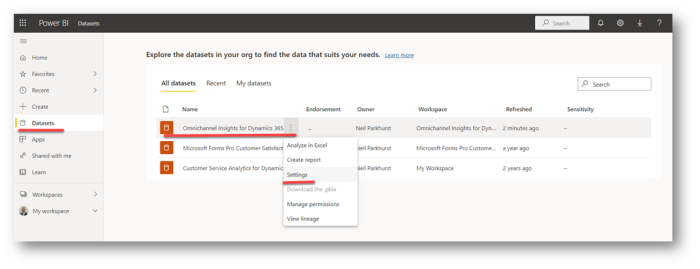
Within Power BI find the datasets option, then on your Omnichannel Insights for Dynamics 365 dataset click “…” and select the settings option.
Within the settings, expand the “schedule refresh” section. And check that the keep you data up to date option is selected and the frequency is set top daily.

Step Six – Publish your application
You must now share the Power BI application with your entire organization, this is required for supervisors to be able to view the Omnichannel Insights dashboards and reports.
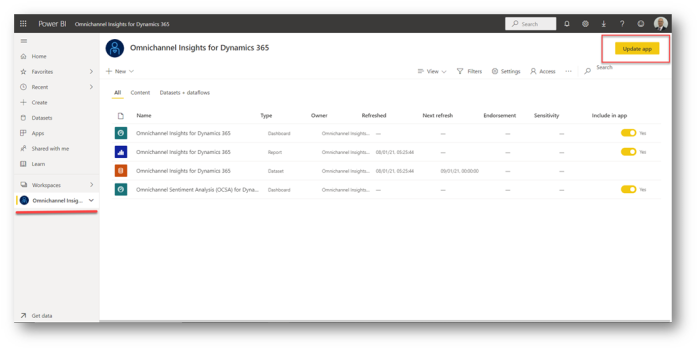
Below you can see that I have selected my app workspace. I then click the “Update app” button.
Finally, navigate to the “Permissions” tab and select the “Entire organization” option. Then click update app.

Step Seven – Add Power BI dashboards to Omnichannel for Customer Service
We are now ready to configure Dynamics 365 so that the supervisors can see the Omnichannel insights and sentiment analysis dashboards.
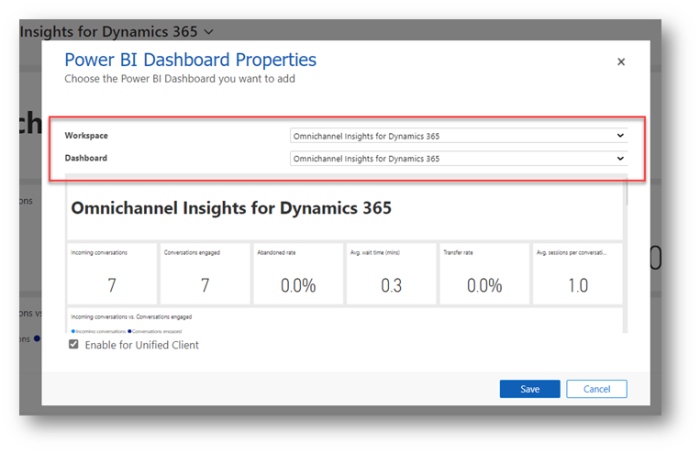
Each supervisor will need to add the sentiment and insights dashboards. Therefore from the dashboards option that will select New and then select Power BI.

Each supervisor can then the omnichannel insights workspace and insights dashboard.
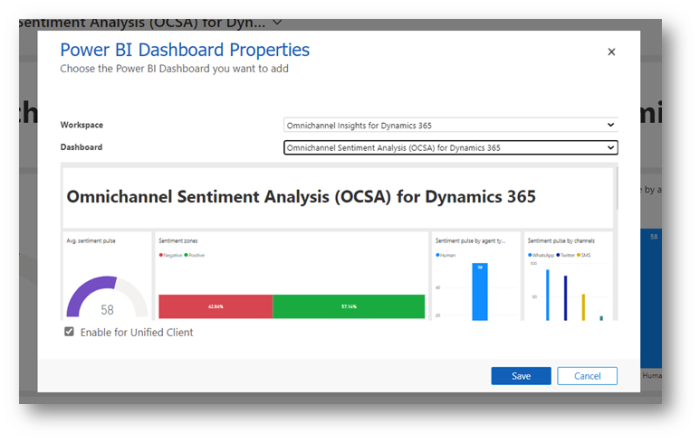
Assuming they require the sentiment dashboard as well as the insights dashboard then they will need to also select the sentiment analysis dashboard.
Once completed the supervisor will have two dashboards that can be selected.

Dashboards
Ok … so now you have two dashboards but what information can you expect to see? In this final section I will describe the key elements of each dashboard. I might not cover everything just the key information!
Obviously the best thing to do is configure the dashboards and see what you actual data look like. But in this section I will try to highlight some of the insights I found most interesting. I will also comment on what actions I completed in my tests to generate this data!
Let’s start by looking at the Insights dashboard ….
Omnichannel Insights for Dynamics 365
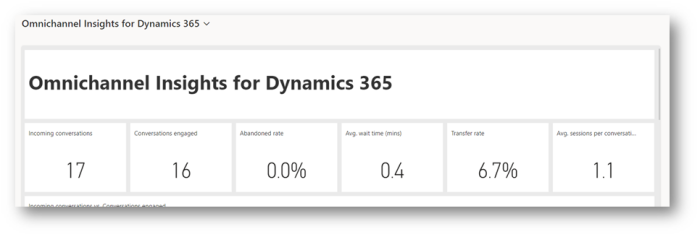
The insights dashboard gives you an overview of activity. The top section of the dashboard contains some useful cards that tell me how many conversations have happened etc.
Notice I have 17 incoming conversations but only 16 have been engaged with. This is because I had one conversation that the customer started but no agents accepted.
As Microsoft’s documentation described the abandon rate is the percentage of conversations that are not engaged by agents I was surprised to see that it initially remained at 0%. I did some further tests when I did see the abandon rate change. I think an abandoned conversation is one that is never routed to an agent. Maybe the customer shuts the chat widget almost immediately or maybe no agents are available so the customer aborts before the conversation can be routed. Whereas conversations that are routed but the agents don’t converse with the customer seem to show in the difference between incoming conversations and engaged conversations. But don’t count as abandoned.
I mention abandon rates as in my experience this is a KPI which the supervisors may wish to keep a close eye on. Therefore understanding its meaning maybe important. An increase in customers abandoning conversations before they connect with an agent might suggest you need more agents!
My average wait time was pretty low as generally speaking I connected with each test customer straight away. And being a test system meant I didn’t have a large volume of live customers engaging concurrently!
I did simulate one agent transferring a conversation to another agent. Hence I have a transfer rate.
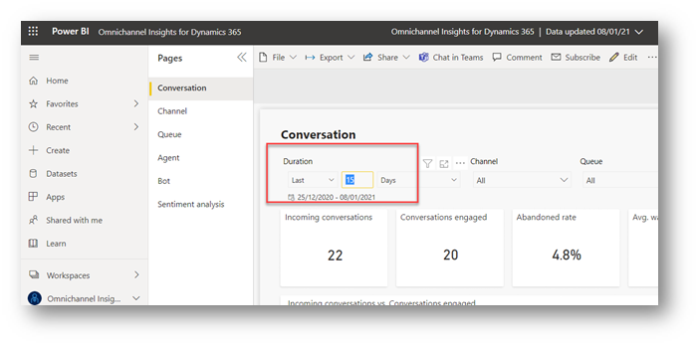
Below these initial tiles I get a chart showing the number of conversations by day for the last 15 days. Plus charts show the average wait timer per day, average length of conversations and transfer rates per day.
One tip I have here is that you might want to open the dashboard up in Power BI directly. As the date range for these charts could be tweaked. (As shown below.)
I also see a useful chart which gives me an average score from my sentiment analysis. Although if you want to dig deeper into sentiment analysis then the sentiment dashboard will give you more information. (I will mention that later in this post.)

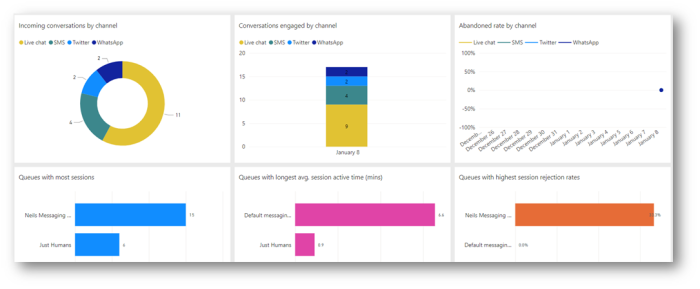
I then get a bunch of charts showing me the conversation stats by channel and queue. I found it especially useful to see how many conversations I’d taken on say Twitter compared to WhatsApp. Etc.
Next I see similar information but by agent. In my test I had just two agents. Me and my dog! But I hope you can see that being able to see how many conversations had been taken by each agent could be really useful.
Tip: One agent handling more conversations than another could in theory flag a management concern. But equally it might be highlighting that due to agent skills based routing and capacity you have a tendency to route conversations to particular agents. So these stats may give you some clues on how your Omnichannel routing can be improved. In my example I found my agent had a much higher capacity than any other agent and therefore the conversations were not routed evenly across my agents.

The final group of charts showed me BOT conversations, including details of resolution rates and escalation rates. I think it would be really useful to understand how many BOT conversations get escalated to humans!

Sentiment Analysis Dashboard
Next I looked at the sentiment analysis dashboard. I found this one really interesting!
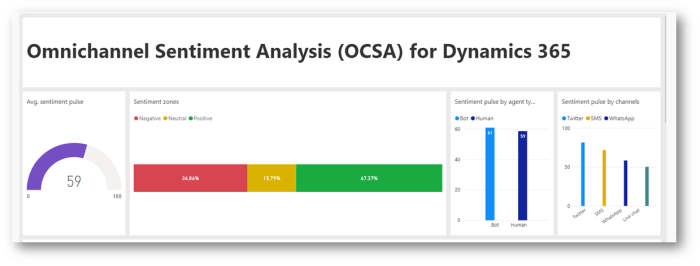
The first tile on the sentiment analysis dashboard shows us the average sentiment pulse we saw this on the omnichannel insights dashboard! But we also have a chart showing the sentiment zones, this gives a sense of what percentage of conversations fall into negative, neutral or positive rankings.
This pulse is then further split down by type of agent (aka human or BOT) and channel. For example, In my test data conversations one Twitter seemed to be more positive than live chat.
I only had a couple of test agents but I next see some charts that show me sentiment scores by agent (for the agents obtaining the lowest and highest scores).

Beyond this I see sentiment by queue and also channel (by day).
I hope you agree that enabling these insights is quite straight forward and we can view loads of useful information about our conversation volumes and sentiment. Enjoy.


No comments:
Post a Comment