DEBUG A PLUGIN
There may be instances where you are debugging a plugin in Dynamics 365 and when you run the profiler, it produces the error “An error has occurred. The selected action was not completed for one or more records.”
You may be running the profiler under the setting Exception:
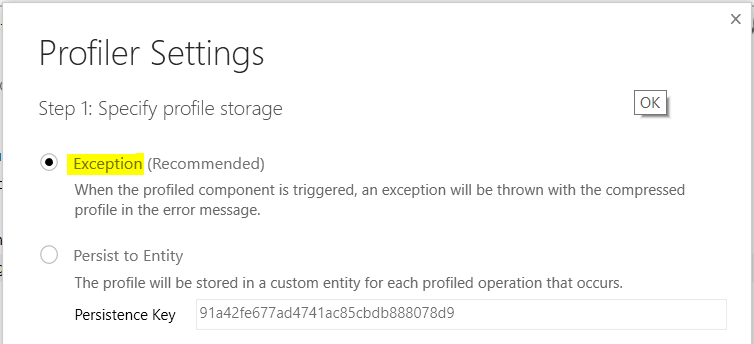
In order to get around the error, use the Persist to Entity setting.
Select the setting and click OK to start profiling. Then, run your action which causes the profiler to run. You will not see a dialog box like you do with the Exception setting, which downloads a file. Instead, everything will run as expected.
Attach Visual Studio debugger to the Plugin Execution Tool process, so it is ready to debug, and set a breakpoint in your code:


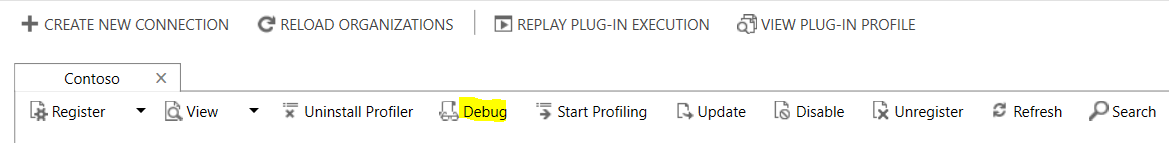
Next, in the Plugin Registration Tool, stop profiling, and go to Debug:
This will open the Replay Plugin Execution window. Select the drop down arrow:
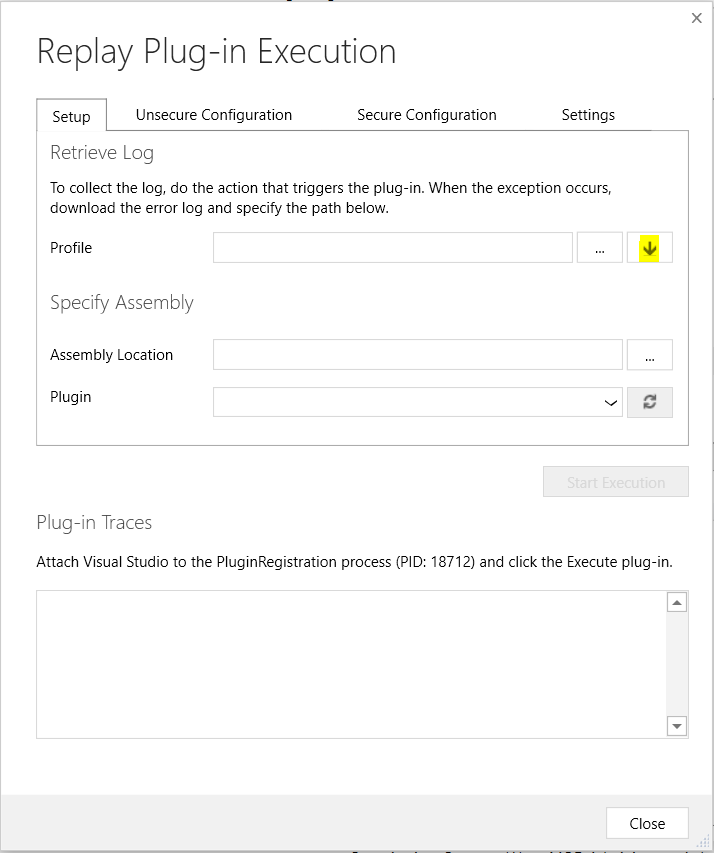
From here you will see a line with the time and details for each profile that has been run. Select the profile that you want to debug:
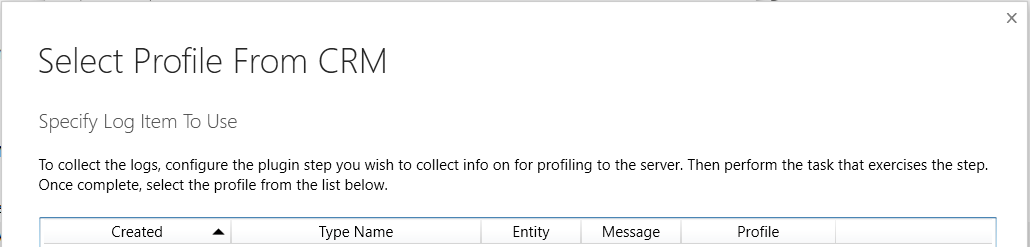
Also note, if you are debugging many to many relationships, you may see multiple entries in this section. There is an entry for each of the target entities.
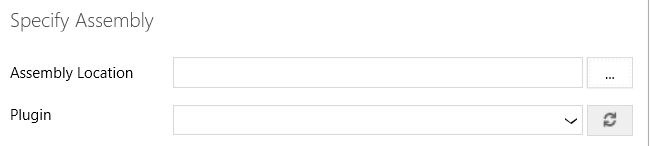
Then select the assembly and plugin.
Click Start Execution:
You can now debug your code.


No comments:
Post a Comment