As you are aware, using Plug-in Profiler option we can debug D365 online plug-ins by throwing exception and capturing the Serilaized profile. Refer my previous article
With the ‘Exception’ profiling option, you first need to trigger the event and capture the exception log. For example, if you need to debug “Post Account Create” plug-in, you first need to trigger the event (i.e., Create Account from D365 application) and capture the exception log. This ‘Exception’ option would be apt, if your plug-in registered in Sync mode.
What if your plug-in is Async? Answer is, using “Persist to Entity” profiler option.

Let’s see how to debug Async Plug-in step by step.
Configuring Profiler in Plugin Registration Tool:
- Connect to your Dynamics instance using Plug-in registration tool.
- Click on ‘Install Profiler’ button
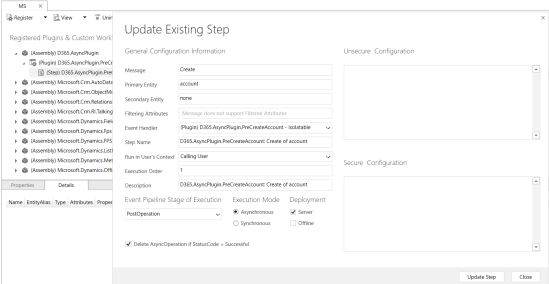
- Register a new plug-in assembly and add an Async step
- In this article, I registered an Async step on Post Account Creation
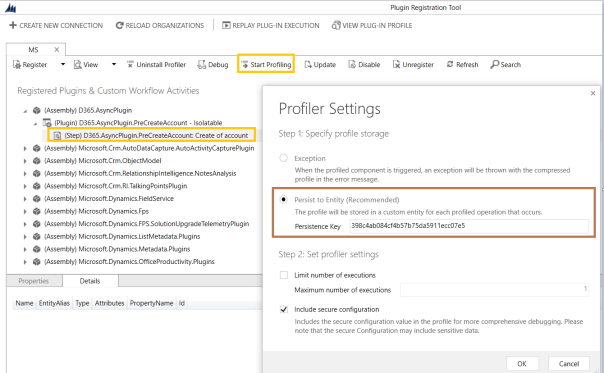
- Select the Plug-in step and click on ‘Start Profiling’
- In the “Profiler Settings” screen, choose “Persist to Entity” option and click “OK”
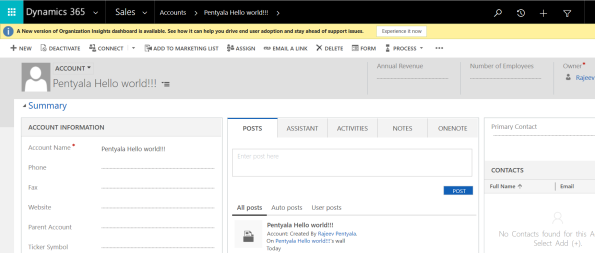
Trigger Account Creation from D365 Application:
- Connect to D365 application and create a new Account
- As we opted for “Persist to Entity” profiler option, an entry will get created in “Settings -> Plug-in Profiles” entity.
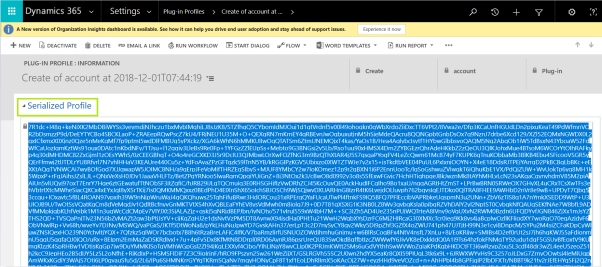
- Go to “Settings -> Plug-in Profiles”, open the newly created “Plug-in Profile” record (Note: Async plug-in takes time to create a new “Plug-in Profile” record).

- In the “Plug-in Profile” record, you would notice the Serialized content in “Serialized Profile” field. This is same as what you get in Exception download log if you would have opted for “Exception” profile setting.
Debug the Plug-in:
Once an entry got created in “Plug-in Profile” record
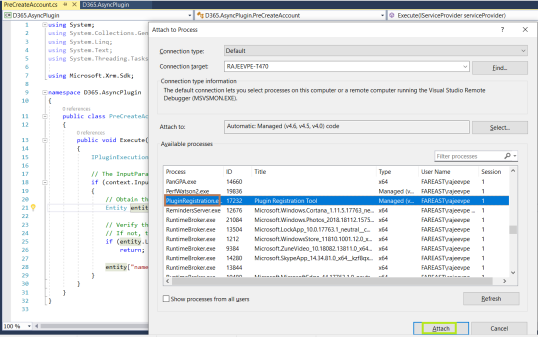
- Open the Plug-in class file in Visual Studio and attach “Plug-in Registration Tool” process
- Add a break point in your Plug-in class file to debug.
- Open the “Plugin Registration Tool”
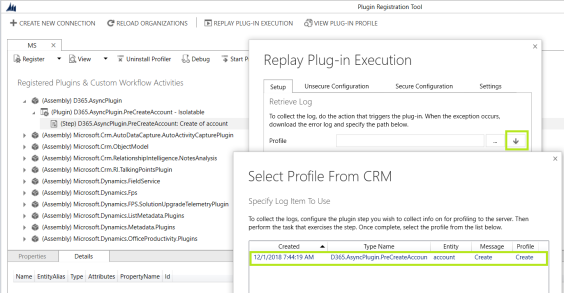
- Select the Plug-in step and click on “Debug/REPLAY PLUG-IN EXECUTION” button
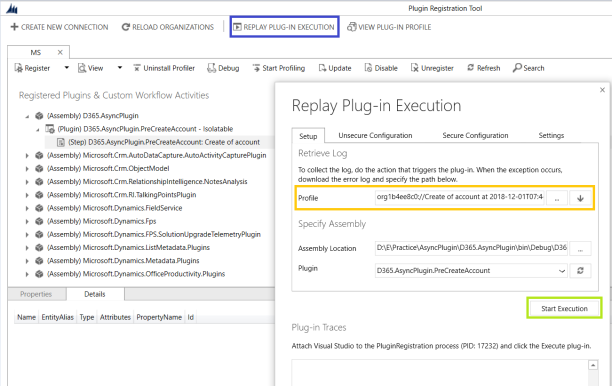
- In the “Replay Plug-in Execution” screen, set
- Profile = Click on ‘Down Arrow’ button to pick your “Plug-in Profile” record from D365 (Refer screen)
- Assembly Location = Plug-in dll
- Plugin = Class Name
- Click on “Start Execution”
- You should see a break point hit in Visual Studio.

- Press F10 to proceed with debugging.


No comments:
Post a Comment